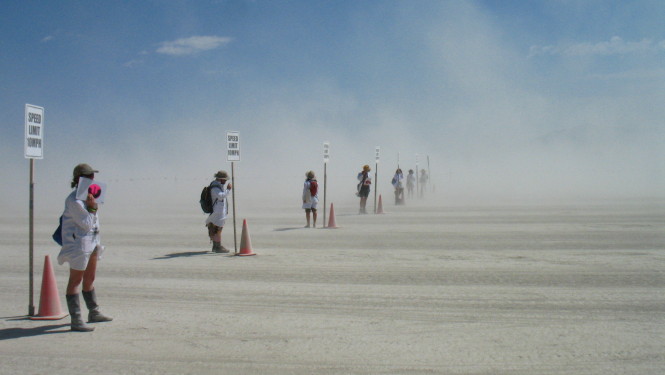

Hey, did you notice us while you drove up to the Black Rock City gate? We were the ones wearing white lab coats, asking you questions, and having tons of fun. One of us had a fox face, one of us had glowing green Medusa hair, and several of us had bunny ears and fishnet stockings. On some days, we were all coated in a thick layer of dust.
If you met us out there, then you already know what this year’s Census sampling team was up to. We recited our informed consent scripts, and let you know that your participation was completely voluntary and anonymous. We explained how our volunteer researchers would use a few tidbits of data about you to get a sense of who, exactly, comes to Burning Man. And then you took four or five minutes to answer eight questions on a paper form, and voila!, you had given your first gift to Burning Man. The gift of data.
The backbone of this sampling effort, naturally, was our extraordinary volunteers! We had five sampling teams that covered five sampling shifts, some of them pre-dawn (we got to watch the sun rise together!) and some of them in the full blast of midday dust. We welcomed you home, and most of you were happy to help us out. Thanks! Then our datatypistas set to work digitizing your survey responses, so we could analyze the data.
But why did we do this? This year we expanded our Census project to include data collection from a randomized sample, which was a first for us. Why you ask?
The first reason is that, for ten years, we’ve collected data about the population of Black Rock City through a long-form survey, as part of the Census project, but it’s a “convenience sample,” and we really wanted to adjust that data with a “randomized sample.” The randomized data collected by the samplers at the gate were used to weight the data we collected in the census long forms, which means that we have a much more representative picture of our population. (And yes, we realize that this is not a true census, because we’re not able to collect data on all 50,000 plus burners at the event. But I hope you’ll indulge our playful use of the term “census” in this context.)
The second reason for doing the randomized sample is that we wanted to get sound science behind some basic demographic profiles of all you incredible people. Simple stuff, like age, gender, and citizenship. But we also looked for some other potentially useful data on questions about how often you vote, and how you got your ticket. In fact, the data we collected about ticket source and ticket price indicates that very few tickets to this year’s event were purchased from scalpers.
We have analyzed that short-form data already (see below!). And we are currently working on the re-weighting of the long-form Census data. We’ll use the sample data to adjust the Census data so that it more accurately reflects Black Rock City, and we’ll get those results to you just as soon as we can.
Here are the results of the random sample. We have given our estimate for each variable along with 95% confidence intervals–which means that we are 95% confident that the true value fall in this range. Enjoy!
AGE
Under 20 years: 4% (1% – 7%)
20 – 40 years: 71% (65% – 77%)
Over 40 years: 24% (19% – 29%)
Average age: 34 (33 – 36)
CURRENT GENDER
Female: 38% (32% – 44%)
Male: 60% (56% – 65%)
Both/neither/fluid: 1.5% (< 1% – 3%)
Percent of population who are at Burning Man for the FIRST TIME
39%* (32% – 45%)
*Note: We assume that this number is higher than the true value. Remember that we started sampling on Sunday, after many returning participants involved in major projects had already arrived on playa. Next year we would like to extend our sampling window to include these early arrivals, which will improve the representativeness of all our results.
TICKET SOURCE
Burning Man: 60% (55% – 64%)
friend: 27% (25% – 28%)
stranger: 6% (2% – 11%)
third party reseller: 3.3% (2.6% – 4.1%)
TICKET PRICE
More than face value: 6% (4% – 7%)
Face value: 74% (72% – 75%)
Less than face value: 8% (5% – 11%)
Gift: 5% (3% – 7%)
MISCELLANEOUS
Percent of eligible voters who VOTED in at least one of the last four federal US elections
83% (80% – 87%)
Political party affiliation among eligible voters
Democratic: 34% (30% – 38%)
None: 33% (26% – 40%)
Republican: 24% (18% – 29%)
Other: 3.5% (2% – 5%)
Green: 1.5% (< 1% – 2.2%)
Percent of the population for whom English is their first language
86% (81% – 90%)
Percent of population who reside in the US
76% (59% – 93%)
This is awesome! Thank you for all your efforts! Having some data will be really helpful for planning and to put a lot of myths to rest.
A question – would you say the 39% virgin rate was higher, lower, or about the same compared to previous years?
Report comment
Why not provide participants with a real census form along with their tickets (mailed or on will call) so we can fill them out and mail back to BMOrg once back in the default world? That way you would have a much bigger/better sample.
Report comment
Sour Patch- what you described is called a ‘convenience sample’. This post briefly touches on how that’s less useful than a ‘random sample’ as collected at the gate, or other methods. The goal these days with the sample is to improve statistical accuracy/reliability, which convenience samples do not provide. As it stands, specific demographics are more/less likely to fill out the census than others. Making the census available after won’t necessarily give us ‘better’ information, even if we do end up with ‘more’ of it.
Hope that clarifies a bit about how the census is shaped/ is evolving.
Goldstar
Report comment
Glad to hear about this addition to the census. I love the census project and it’s noticeable how backlogged it is due to the data entry abor involved in compiling all the entries… Plus this is a more scientific census. I wish you would publish more of the results from this sample.. As I recall, there are questions about political affiliation, sexuality, income and other interesting tidbits. Please publish the rest!
Thanks.
Report comment
25% republicans???!!!! Really????
Report comment
Having sent the following back in 2007 (5 years ago!), I am delighted that the organization has finally faced up to it obligation to provide scientifically valid information on its attendees.
By posting BOTH the original “Census” and the weighted “Census” for the 2012 event, you will enable us to make rough, thumb-nail assessments of the numbers from “censuses” of prior years, 2011, 2010, etc.
And, yes, I do object to the miss-use of words, especially when the word being miss used (census) is fundamental to our system of government, is part of our constitution, and plays a critical role in our society. Thus, am very please to see you helping set straight what a census is and what a census is not, and that you are not doing a census. Next step: stop using “census” as the name of the your volunteer sampling.
My impression is that back in the late 1990’s the Burning Man organization listened better than is has in the 2000’s. Perhaps listening is now improving.
Following (slightly edited) sent to the Burning Man organization in 2007 – No e-mail address(es) nor positive replies were ever received. Apparently, it WAS too much to ask. Trust displaying this isn’t.
——————————————————————————————
S.F. [Full Name Removed]
Thank you for your prompt and thorough reply. [to a prior e-mail offering to do a pilot statistical survey towards measuring attendee characteristics]
About the survey I want to do:
All I really need is the e-mail address of the person(s) in charge of the gate.
But to answer your concerns, read on:
I have been attending this even for 10 years and running a theme camp (Safer Sex Camp) for most of those years. I am well aware of your “census”.
Permit a professional statistician a few words. A “census”, by the proper statistical definition of the word, is a complete, 100% enumeration of, and data gathering from, a defined population, in this case, each and every one of the people at the event.
You are as aware as I am that what is called a “census” at Burning Man is no where near a complete enumeration of all (25,000+) of those attending the event.
What the “census” people are doing is a volunteer, non-random sample of those attending the event. It is an admirable and time consuming effort. However, volunteer, non-random samples are notoriously unreliable. Worse, their reliability cannot be neither measured nor evaluated. One has no idea if they are providing reliable or unreliable information. They do a better job of tracking trends over time of the segment of attendees who complete such forms.
This professional statistician wants to do a sample survey which can provide reliable information, a survey whose reliability can be measured. To properly plan such a survey, I need to estimate the variability of what is technically known as sampling strata.
As for interfering with the activities at the gate, I will NOT be interviewing people at the gate. I will interview people some half-hour to an hour back in line from the gate. They are sitting there bored anyway – I’ve been there. This line of attendees provides an opportunity to do a proper statistical sample of your attendees. This is why I want access to the line.
Interviewing at the greeter’s station has two problems. One, they no more want me interfering with what they are doing that do the people at the gate. Nor am I any more inclined to. Secondly, the one line is now several lines, making a proper statistical sample far more difficult and requiring far more interviews for the same level of reliability of a variance estimate than does a single line.
As for confusion with the “census”, that is, people declining to fill out the census form for confusing my interview with the “census” form, I will be interviewing at most some 300 people. Even if all of these 300 would otherwise have completed the “census” form (unlikely), 300 out of 25,000+ will make no difference for the “census”.
As for the duplication of information, I am only getting estimates of variance, so only need a few items of information. I am not trying to duplicate the many items of info the census people gather.
S.F. [Full Name Removed], I need your help. Check me with C.R [Full Name Removed] and/or L.H. [Full Name Removed]. They know me.
Can you send me the e-mail address of whom ever is in charge of the gate and forward this to her/him?
Not much to ask, is it?
Thanks
Robert Wilson
Report comment
By making all of the data from your random sample from Sunday on taken at The Gate, you will allow anyone skilled in a spreadsheet to compute any crosstabulations they wish.
An excellent opportunity to demonstrate your policy of transparency, full disclosure, etc. Make all the data public.
Report comment
Congratulations! I have a long background in survey research methods so I know what a challenge you faced in collecting a random sample that can be weighted to provide representative data estimates. And what a brilliant job you did. I love the idea that Robert posted of using the data to reweight data collected from prior non-random samples. Yes, it’s not a census, but to the non-nerd “census” is just more understandable and interesting than “random sample”
Report comment
I’m surprised, too, that there are that many Republicans. I had no idea there were that many of us! Doesn’t seem to matter, though, but I’ll correct my prior guesses that I’ve reported to all my non-burner friends like this: “Out on the Playa, it’s mostly left wing types and some anarchists on one end of the spectrum, and just a few right wingers and a smattering of survivalists, but we all seem to get along so well out there. It’d be great if we could bring that back to the default world.”
Report comment
24% Republican? I’m kind of surprised. I’d think it’d be less. Just sayin’.
Report comment
The random sample result of 25% of event attendees being members of the Republican party contrasts to the percentages from the “census” posted for the years 2005, 2007, and 2008 of (respectively) 5%, 9%, and 9%. The Republican presidential candidate, Mitt Romney, got 47% of the Nevada presidential votes in the 2012 election. Many event attendees are from Nevada. The erroneous percentage may or may not be from the sample data.
Along with making all of the data available, the census team needs to include the details of the sampling and statistical methods they used. For example, in computing the confidence intervals, did they utilize the Poisson distribution for small percentages? Was the sampling done 24/7 or selected days/hours, and if so, which days and times?
The sample data will need to be weighted by the counts of collected tickets on as fine a time scale as possible, at least daily, if not hourly. Thus, data on the number and time of tickets collected also needs to be provided with the details of the method of weighting the sample.
The provision of such details is standard practice in publications employing statistical analysis. For an example, check the methods section of any article in the New England Journal of Medicine.
As the number of attendees changes over the week, so probably will the summary descriptions of the attendees change over the week. Should the summary of the sample data present a weighted summary description, weighted by the number of attendee-days with each characteristic? Or, should the summary report the percent male/female as of Monday, as of Saturday, or some grouping of days? The counts and timing of ticket collections would provide the weights for this adjustment.
The 2012 “census” has the same problem of using a single summary to describe a changing population. The reported date of completion of the “census” questionnaire can be combined with gate ticket gathering information to weight the “census” to improve the summary data. The problems of self-selection, non-random convenience sampling remains.
It is widely accepted (but not necessarily so) that the composition of attendees changes between Monday-Wednesday to Thursday-Saturday. The random sample may be able to describe this change, if it in fact occurs.
Only a very small fraction of the data gathered in prior “censuses” is summarized on the Burning Man web pages. The questions selected change from year to year, even gender is not shown for some years (2002, 2010). Categories are not consistent from year to year, for example, age breaks. Some of the data is suspect, for example in 2010, 25% of the participants claimed to have arrived at the event by airplane; this represents 10,000 people flying in the event.
There are a lot of “smarts” among event attendees who could extract from the sample data of 2012, and the “census” data of 2012 and prior years useful information with reasonably estimated error bounds and do so in more consistent manner.
To do this, they need all of the “census” and sample data, questionnaire by questionnaire, less personal identifying data, and various auxiliary data, such as the timing and count of tickets collected at The Gate.
As seen in the blog posts confidence in at least the reported percent of Republicans is not as high as one would hope, and possibly rightfully so.
The solution is to make the data public and let them compute the percentage for themselves.
Sad, to say, I am taking very long odds on the probability of the Burning Man organization making public the sample or “census” data.
Report comment
Errata: In the above post, the percentage should be 20%, not 25%, of the participants claimed to have arrived at the event by airplane.
Report comment
Thank you everyone for all your wonderful ideas and comments. Your enthusiasm and love of statistics is awesome. Please consider joining us next year on the playa and help us make this Random Sample happen again. We need volunteers who can collected data, enter data, crunch data….oh so much to do!
Report comment
Great statistics! It seems interesting to me that quite many people over 40 years old attended festival and that it is definitely more male festival than female:)
Report comment
I’m a journalist…can I get a more precise number on how many of us are over 60? My premise for the story I plan to write this year is WHY are there so many more older (over 60) men than women at BM? Any ideas?
Report comment
Comments are closed.